Getting started
The HTTP Archive is an open source project that tracks how the web is built. Historical data is provided to show how the web is constantly evolving, and the project is frequently used for research by the web community, scholars and industry leaders. If you are interested in digging into the HTTP Archive and are not sure where to start, then this guide should help you get started quickly.
There are over 1 million pages tracked on desktop and emulated mobile in the most recent HTTP Archive data, and the historical data goes back to 2010. While the HTTP Archive website makes a lot of information available via curated reports, analyzing the raw data is a powerful way of answering your questions about the web.
All of the data collected by the HTTP Archive is available via Google BigQuery. This makes analyzing the data easy because all of the storage and indexing is taken care of for you. And with the processing power behind BigQuery, even some of the most complex queries runs in seconds.
This document is an update to Ilya Grigorik’s 2013 introduction, and walks you through everything you need to get started accessing BigQuery and analyzing the data.
Setting up BigQuery to Access the HTTP Archive
Section titled “Setting up BigQuery to Access the HTTP Archive”In order to access the HTTP Archive via BigQuery, you’ll need a Google account. To document this process for new visitors, this example uses a new Google account that has never logged into any Google Cloud services.
-
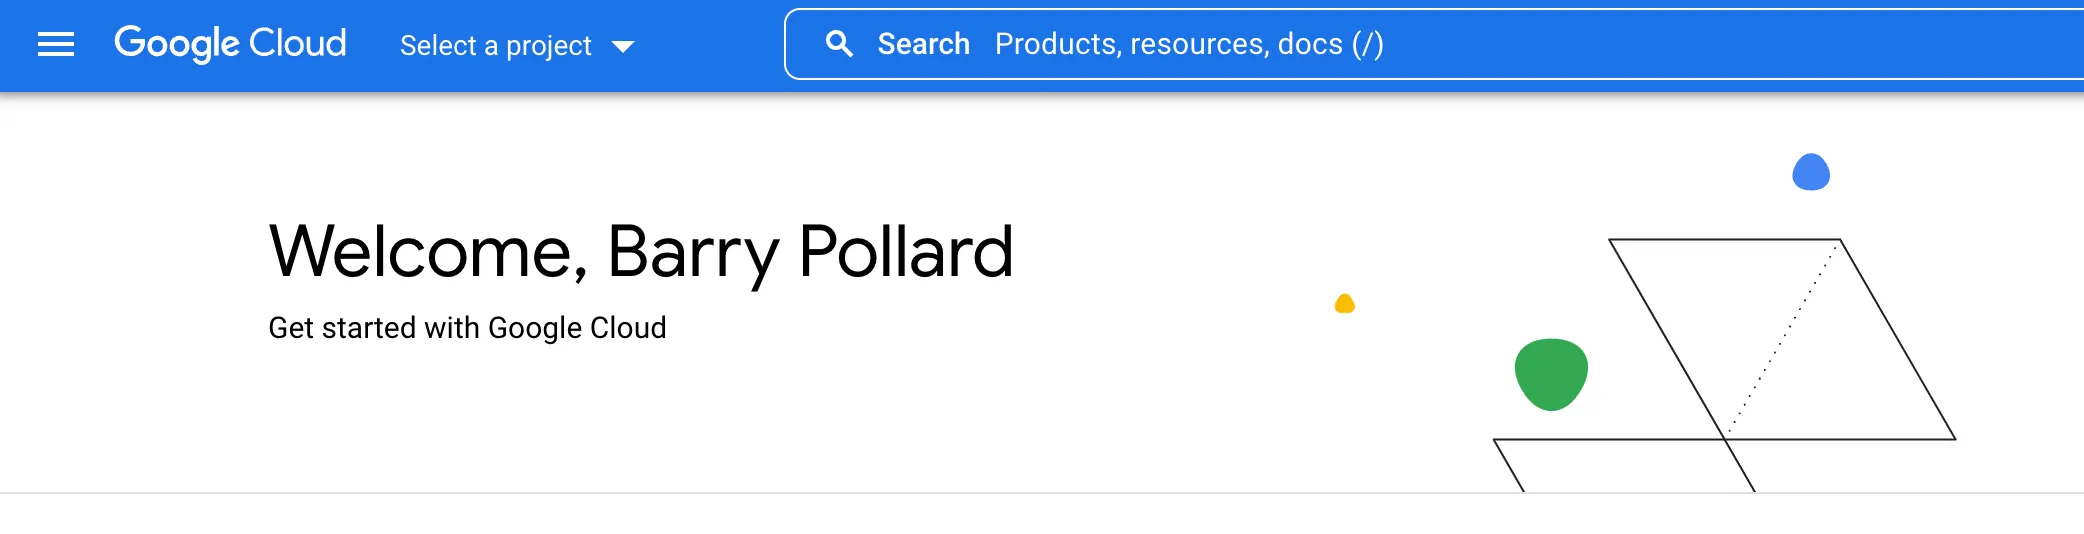
Navigate to the Google Cloud Projects Page and log in with your Google account if prompted. If this is your first time accessing Google Cloud, you may be prompted to accept the terms of service. Once you are logged in, you’ll see a page like this:
-
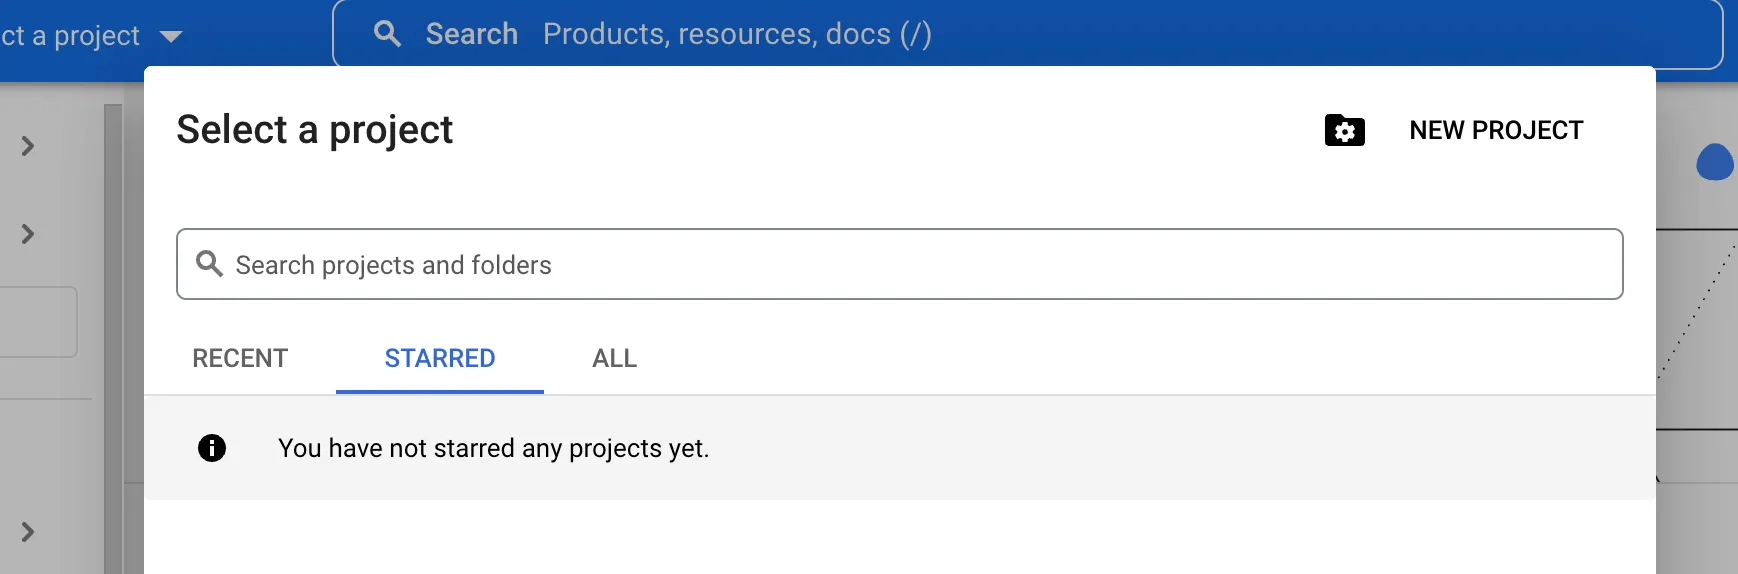
Click Select a project and then New Project. This takes you to a New Project page.
-
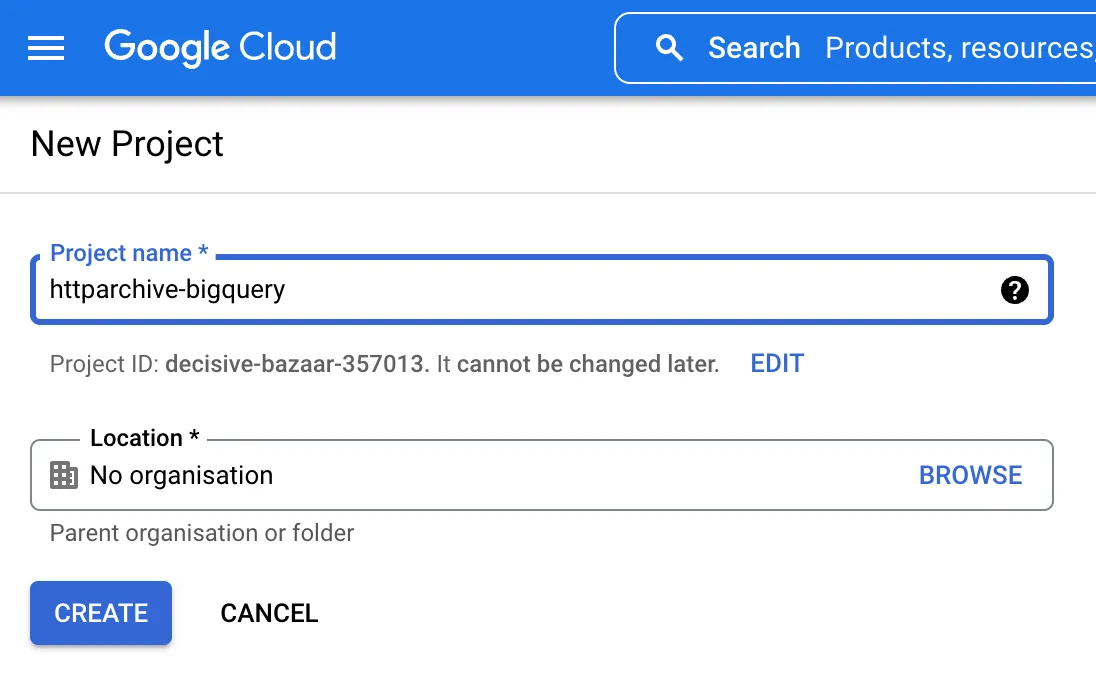
Give your project a name and then click the Create button.
-
Optional: Enable Billing by clicking on the Billing menu item and adding your billing information.
-
Navigate to the BigQuery console where you should see your project, with no data.
-
In order to add the HTTP Archive tables to your project, click on the + Add button on top of the Explorer sidebar and choose the Star a project by name option from the side menu.
-
Type in
httparchive(case-sensitive) and click STAR. -
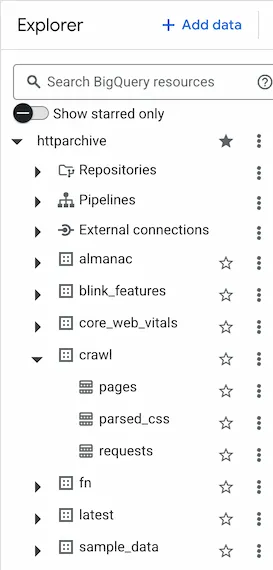
You should now see the HTTP Archive data set pinned:
-
Let’s run a quick sample query to confirm access is all working. Navigate to the
crawldataset and select thepagestable: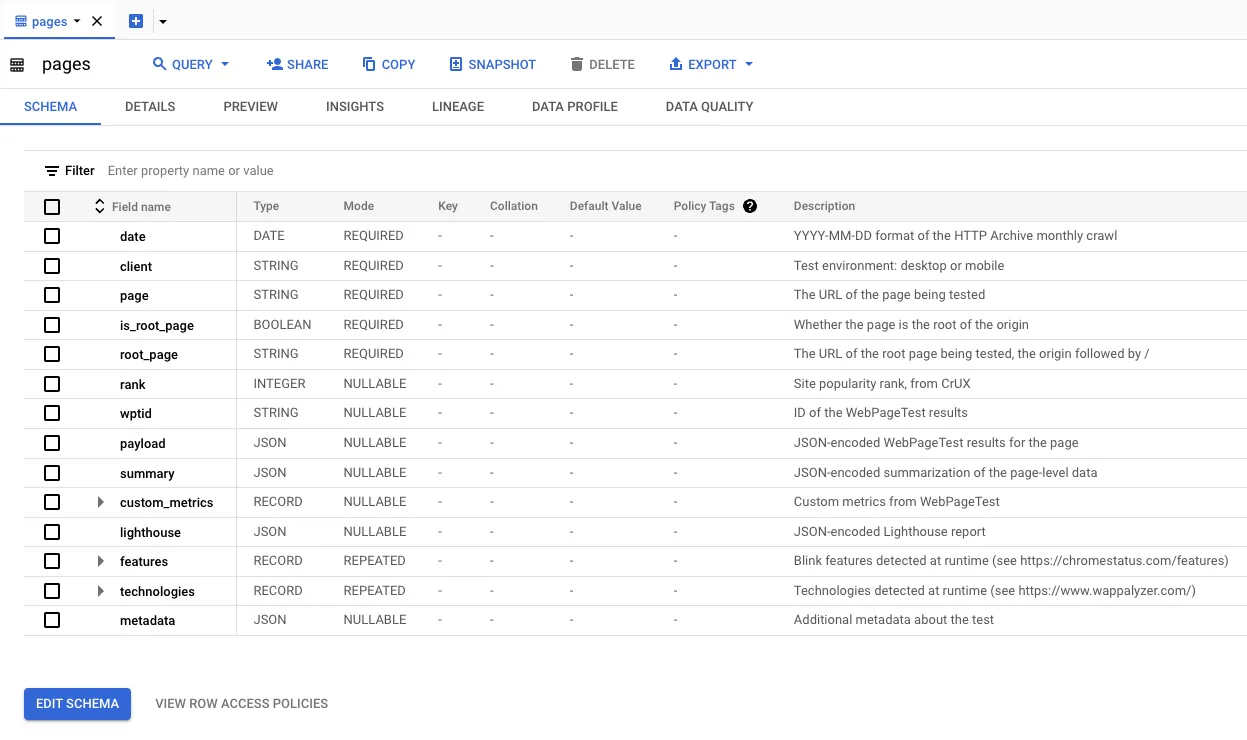
-
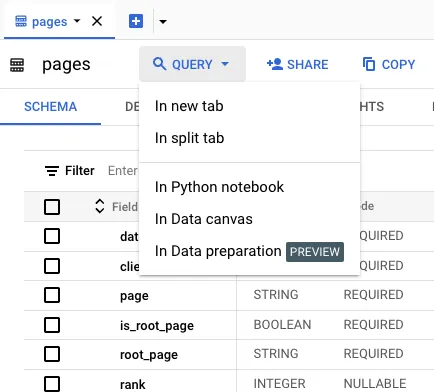
Click on the QUERY button and select In a new tab:
-
Change the query to take a small sample of the table (e.g.
SELECT *), click theRUNbutton and you should see the results of your query.SELECT *FROM `httparchive.crawl.pages` TABLESAMPLE SYSTEM (0.00001 PERCENT)WHERE date = "2024-05-01"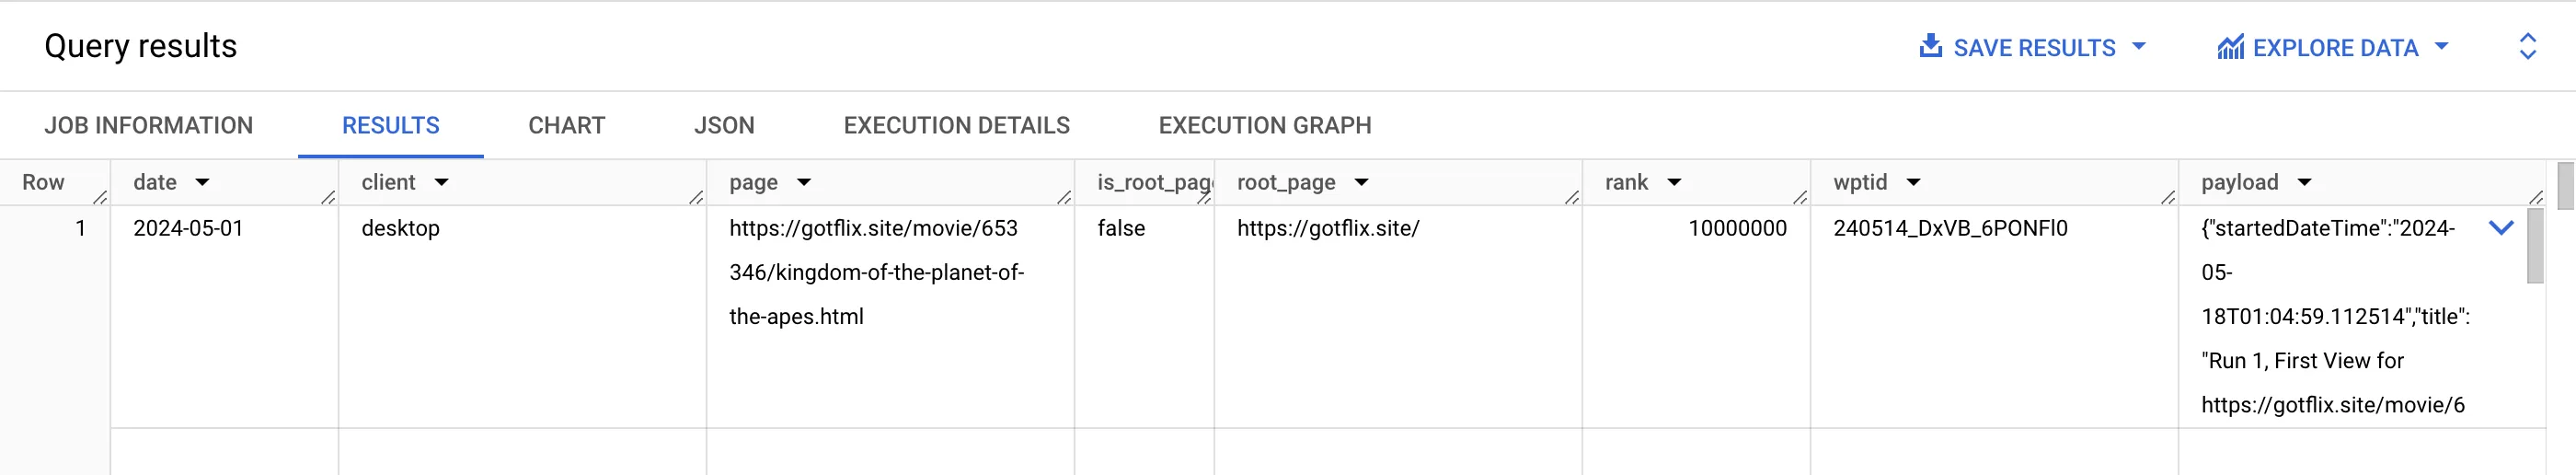
In the next section, we explore the structure of these tables so you can start digging in!
Understanding how the tables are structured
Section titled “Understanding how the tables are structured”So, now you have access! But what do you have access to?
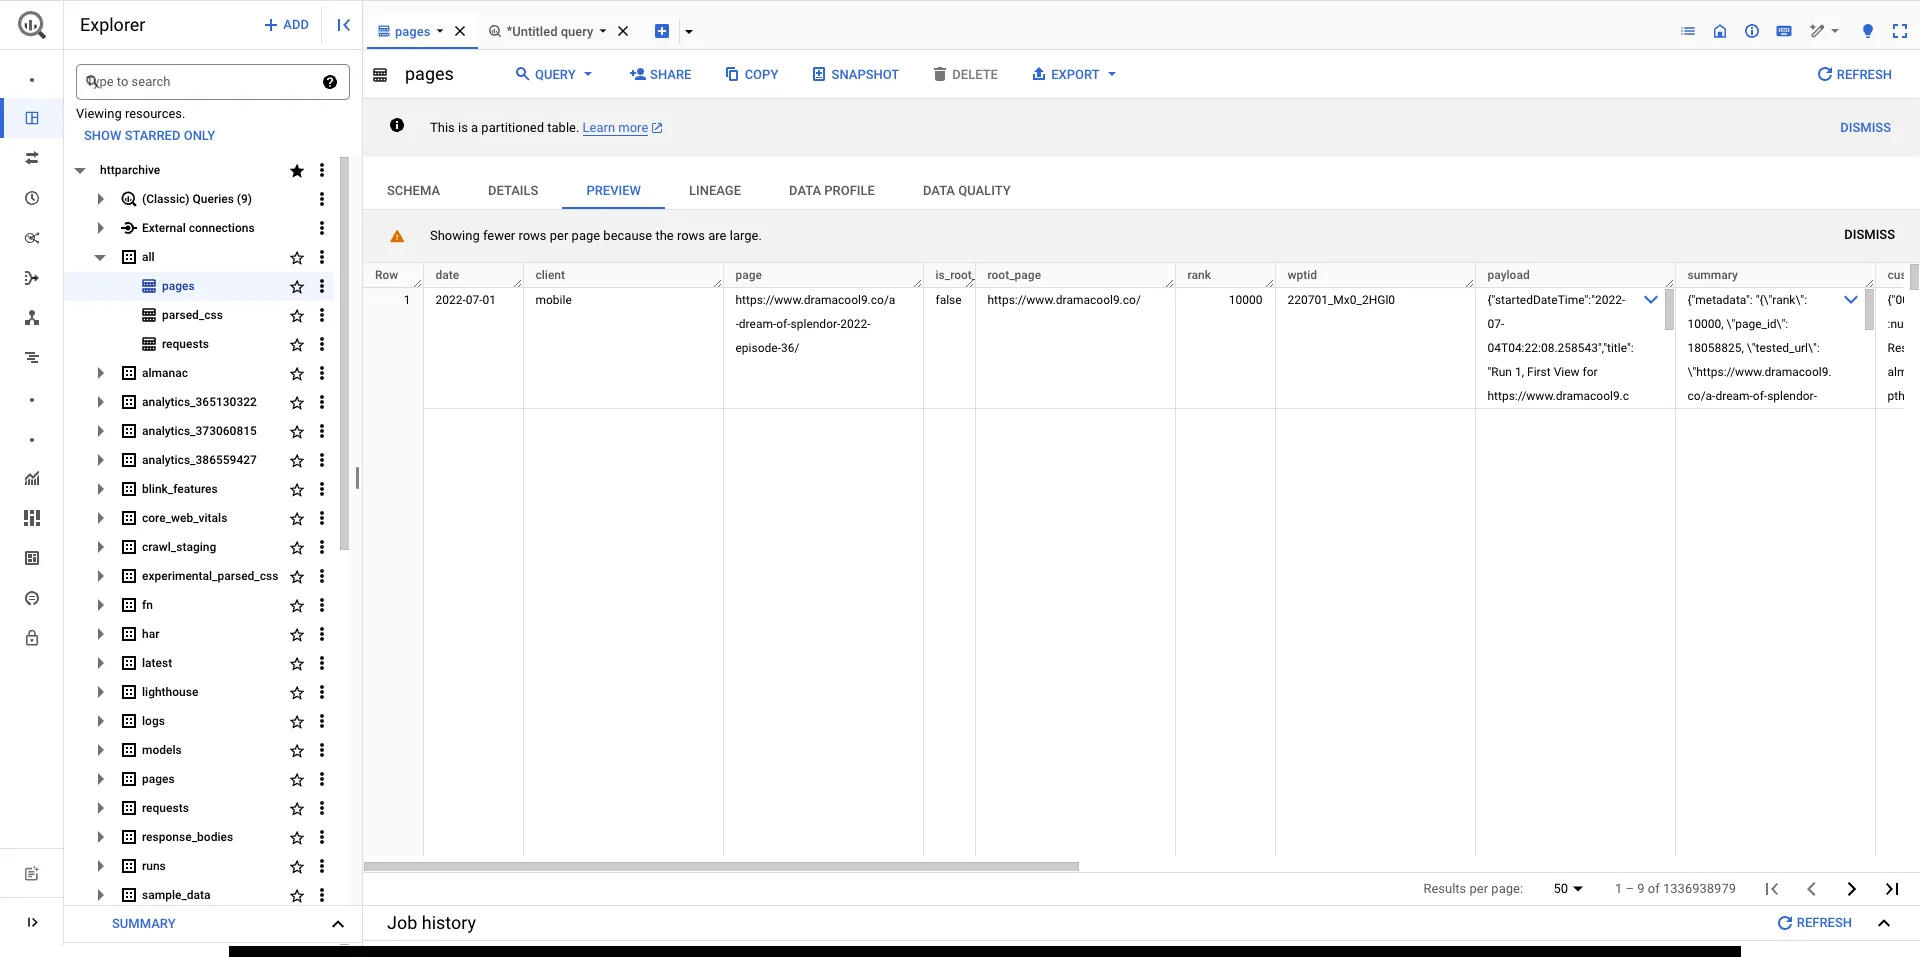
In order to understand what each of these tables contain, you can click on the table name and view the details. For example, if you expand the crawl dataset and click on the pages table you can see the schema. Clicking Details tells you some information about the table, such as its size and the number of rows. Clicking Preview shows an example of some data from the table.
Some of the types of tables you’ll find useful when getting started are described below.
HAR Tables
Section titled “HAR Tables”The HTTP Archive stores detailed information about each page load in HAR (HTTP Archive) files. Each HAR file is JSON formatted and contains detailed performance data about a web page. The specification for this format is produced by the Web Performance Working Group of the W3C. The HTTP Archive splits each HAR file into multiple BigQuery tables, which are described below.
-
httparchive.crawl.pages- HAR extract for each page url. -
httparchive.crawl.requests- HAR extract for each resource.
You’ll find JSON encoded HAR files for pages, requests, lighthouse reports and even response bodies! The table below outlines what these tables include.
| Table | Monthly Size (Oct 2024) | History Since |
|---|---|---|
| crawl.pages | ~30 TB | June 2011 |
| crawl.requests | ~199 TB | June 2011 |
Blink Features Tables
Section titled “Blink Features Tables”-
httparchive.blink_features.usage:- Summary information about the Blink features detected on each page.
- Table contains the number, percentage and samples of URLs for each feature.
- This data is also available in the HAR of the
pagestable but is extracted into theblink_featurestables for easy lookup. - This table is ~1 GB as of Oct 2024.
Some Example Queries to Get Started Exploring the Data
Section titled “Some Example Queries to Get Started Exploring the Data”The HTTP Archive Discuss section has lots of useful examples and discussion on how to analyze this data.
Now that you are all set up, let’s run some queries! Most HTTP Archive users start off examining the summary tables, so we’ll start there as well. Below is a simple aggregate query that tells you how many URLs are contained in the latest HTTP Archive data.
SELECT COUNT(0) AS total_pagesFROM `httparchive.crawl.pages`WHERE date = "2024-06-01" AND client = "desktop" AND is_root_page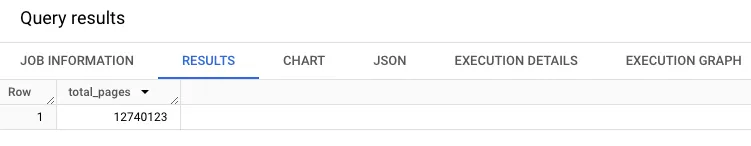
Perhaps you want to JOIN the pages and requests tables together, and see how many page URLs and request URLs are in this data set.
SELECT COUNT(DISTINCT pages.page) AS total_pages, COUNT(0) AS total_requestsFROM `httparchive.crawl.pages` pagesINNER JOIN `httparchive.crawl.requests`requestsON pages.page = requests.pageWHERE pages.date = "2024-06-01" AND requests.date = "2024-06-01" AND pages.client = "desktop" AND requests.client = "desktop" AND pages.is_root_page AND requests.is_root_page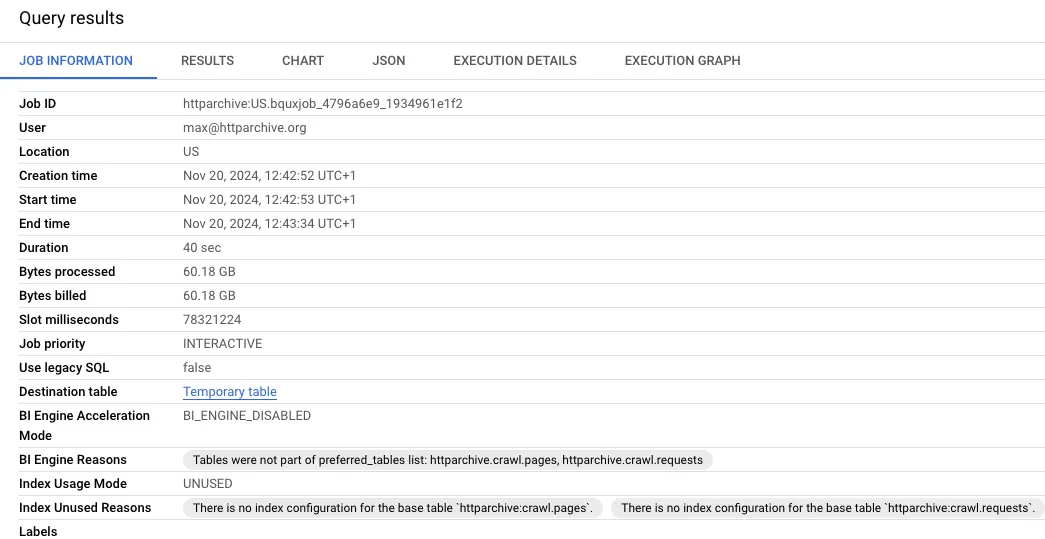
When we look at the results of this, you can see how much data was processed during this query. Writing efficient queries limits the number of bytes processed - which is helpful since that’s how BigQuery is billed.
If you look closely, you’ll notice that this particular query could actually be written without the JOIN. For example, we can count DISTINCT page from the requests table instead of JOINing the pages table. If you run this query, you’ll notice that the results are the same as the previous query, and the processed bytes are a bit less.
SELECT COUNT(DISTINCT page) total_pages, COUNT(0) total_requestsFROM `httparchive.crawl.requests`WHERE date = "2024-06-01" AND client = "desktop" AND is_root_pageNext let’s summarize all of the HTTP requests by a type, and the number of pages that contain at least one request of that type. In the example below, you can see that I added type to the SELECT clause, added a GROUP clause and sorted the results by types that have the most requests.
SELECT type, COUNT(DISTINCT page) total_pages, COUNT(0) total_requestsFROM `httparchive.crawl.requests`WHERE date = "2024-06-01" AND client = "desktop" AND is_root_pageGROUP BY typeORDER BY total_requests DESC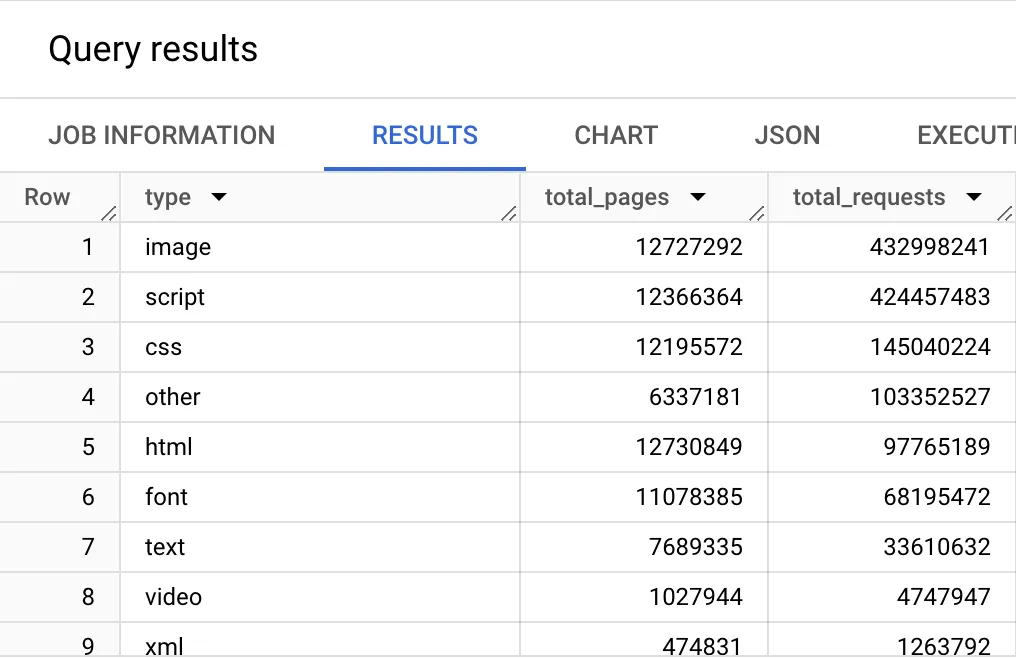
Now things are starting to get interesting. So let’s try to learn something from this basic example. We know from the first example that there are 12.7 million URLs in the latest HTTP Archive dataset. Let’s calculate the percent of pages that have each resource type. To do this, we’ll divide the number of pages by the total pages (using our first query as a subquery). Then we’ll use a ROUND() function to trim the result to 2 decimal points.
WITH requests AS (  SELECT    type,    page,    COUNT(0) OVER () AS requests_total,    COUNT(DISTINCT page) OVER () AS pages_total,  FROM `httparchive.crawl.requests`  WHERE    date = "2024-06-01" AND    client = "desktop" AND    is_root_page)
SELECT  type,  COUNT(DISTINCT page) AS pages_total,  ANY_VALUE(requests_total) AS requests_total,  ROUND(COUNT(DISTINCT page) / ANY_VALUE(pages_total), 2) AS pages_percentFROM requestsGROUP BY typeORDER BY pages_percent DESC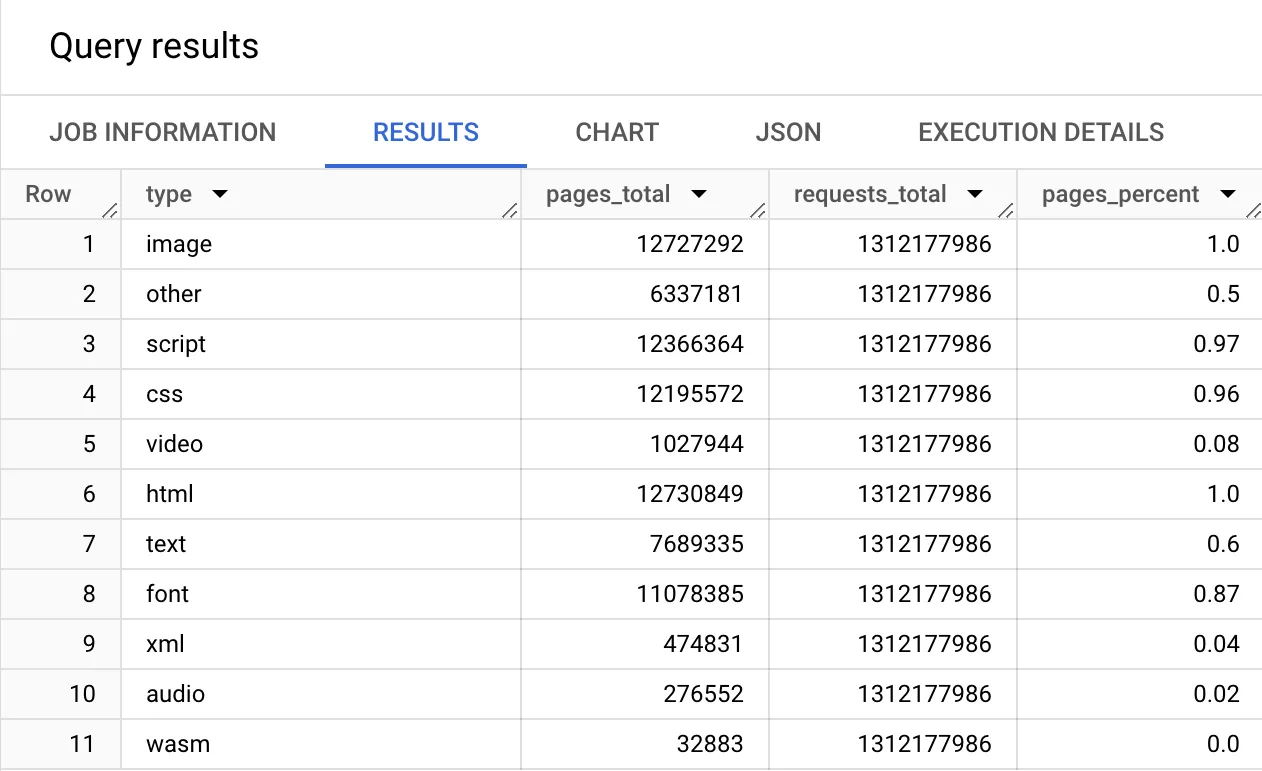
When analyzing the results from this, you can see the % of websites that use different resource types. You can see that:
- 100% of sites have HTML and at least one image,
- 97% have at least 1 script resource,
- 96% load at least 1 CSS style,
- and 87% load fonts on their homepage, etc.
To explore more interactive examples, read the Guided Tour.
If you want to explore deeper you have everything you need - infrastructure, documentation, community. Enjoy exploring this data and feel free to share your results and ask questions on the HTTP Archive Discuss section.